

Wildthing
-
Posts
331 -
Joined
-
Last visited
Content Type
Profiles
Forums
Articles
FAQ
Tests
Classifieds
Store
Group Buys
Everything posted by Wildthing
-
 Here is something a bit techy and basically an issue with 3D systems : I've been reading up on Euler/Cardan sequences and how they are used in 3D systems . From what I've read so far , if different 3D systems use different sequences to calculate how image A was transformed to image B , that the measurements of rotational angles by the 'local segment frame of reference' relative to 'global frame of reference' can be different. So for example one 3D system could say that the pelvis rotated x degrees, side-bend y degrees, flexed z degrees , while another could show different x,y,z rotations. So how can we be sure that the kinematic measurements are a reflection of reality? For example, in the images below I rotated a cube from one position A to another B. I then tried to create the same B image from position A using different sequence of rotations about the X,Y,Z axis such as : XYZ, XZY, YXZ, YZX, ZXY,ZYX You can see that rotation values can be different dependent on the sequence one uses. Now consider that cube represents a body segment , such as the forearm, pelvis , thorax , etc . The body segment is moving from one 3D position in space to another every micro-second. Am I correct in assuming that the 3D software uses the sequence it's been programmed to use (ie. one of the 6 stated above) to perform a calculation of sequential rotations required to get from one instant position to the other? If yes , then how do we assess the accuracy of those measurements? Because another sequence might provide a different set of measurements. How do we decide which sequence is providing a better realistic set of kinematic measurements? The images I've posted of the cube can be a bit blurry so you can't see the rotation values for the X,Y,Z axis. Therefore I've magnified them and posted separately.

-
Just thought I'd post a visual explanation as to why the hand path looks less curved during the early downswing. The top avatar image is at about P4.5 while the bottom avatar P5 , but one can see how much upper and lower body lateral movement towards target is causing that change in hand path to a less curved one as the arms get rotated both in the horizontal and frontal planes. I've added a simple schematic diagram below showing in a very general way how the lead arm could be viewed like a ladder sliding down a wall. The A end being the shoulder joint while the B end being the wrist joint. You can see that the 'hand' path is a vertical straight line as the shoulder moves targetward . The purpose for creating a straighter hand path during the early downswing is to limit an early MOF release of the club (ie. early casting motion) due to excessive hand path motion. The more curved the hand motion , the more likely the MOF moment arm will increase (if you have relaxed wrists and are not physically trying retain the lag angle by active wrist negative torque on the handle).


-
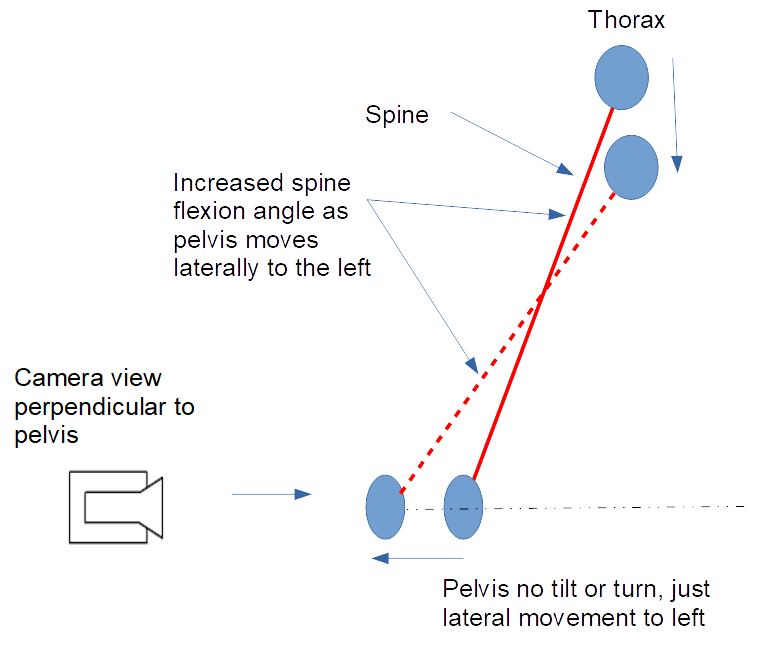
There's been a bit of a debate about the AMG video and it revolves around how 3D systems define and measure spine angles. Definitions https://www.philcheetham.com/two-spine-models-rigid-and-two-segment/ In the video they said the following ( look at the captions in the video frame images further below). "The camera will stay fixed perpendicular to the pelvis, so the only movement you will see will be coming from his spine isolated from the tilting and turning of his pelvis" The problem is that lateral movement of the pelvis (even when no tilt or turn) can cause a change in the flexion angle of the spine. So one cannot assume that Rory is physically muscularly flexing his spine +40 degrees from P4-P5 without taking into the account how the lateral movement of the pelvis could also be affecting that measurement. I've drawn the images of the defined spine line between centre of thorax to centre of spine . The pelvis moves laterally to the left while the camera is still viewing from a perpendicular standpoint. You can clearly see that the motion of the pelvis could also be causing a change in the spine flexion angle. So the viewer might be confused and think he/she needs to try and make their spine flex like Rory from P4-P5 , but miss out on his pelvic movements that could also be contributing to that spine flexion.

-
AMG have just published this video https://youtu.be/up2olhRq6f4 Mike Granato mentioned something that didn't make sense to me at the 12:15 mark (see image below of Rory). He is is saying that his chest and pelvis are moving up at lead arm parallel in the downswing . He says the same for DJ's downswing at 15:52. If you read the youtube comments, someone questioned AMG about that claim and the reply was: ""The gist is - the centers move down the most in the backswing. Lower just a small amount more (~3/8”) very early in downswing then are in the way up from lead arm parallel down." But that claim doesn't seem to match what is found on another 3D system called AMM which uses inertial sensors rather than GEARS optical sensors . Here are Dr Phil Cheetham's graphs for pelvis up and down movement (Drop and Lift). The graphs from AMM3D shows the pelvis, on average, dropping 1.2 inches max in the downswing (3.8 inches for long drivers). But where in the swing does this max pelvis downward motion happen? Is it at P5 , lead arm parallel as per GEARS 3D? I haven't seen any AMM3D chest up and down graphs on any Sportsbox videos, so can't compare with AMG GEARS 3D data. Here are some graphs of other pros on AMM3D The scaling for the vertical axis is 1.3 inches (I think!). The pelvis drop/lift for the bottom two pros seem insignificantly small compared to the thorax drop, but the top two seem to show thorax lift by P5, while the bottom player might be delayed to P5.2-5.5 (unsure to be honest). The last 2 golfers haven't reached P5 yet , so the green vertical line on the graphs would probably shift a little to the right and their rate of degree of upward movement of both thorax/pelvis (ie. the slope of the green and red graphs) are not very large. But the rate of lift increases from about P5.5 -P7.5. The top golfer's thorax is lifting up while his pelvis is dropping approaching P5.


-
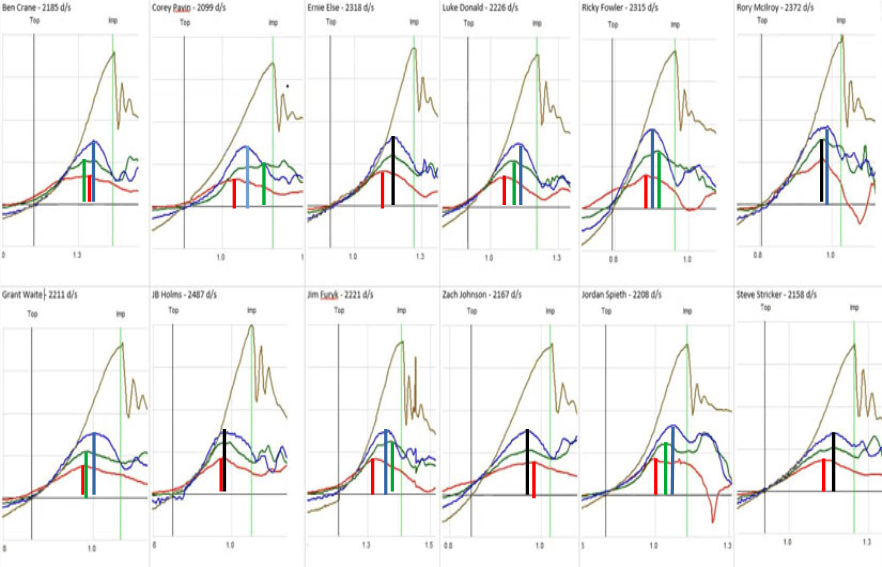
Is the kinematic sequence of the golf swing overegged ? Here are the kinematic sequence graphs of several pro golfers and one can see that although there is generally transition from ground up (ie. pelvis, thorax, lead upper arm , club) the 3D angular velocity peaks do not always follow the sequence pelvis (red) , thorax/chest (green), lead upper arm (blue). Note that the club graph is brown. I've drawn a black vertical line where the peaks of lines seem to coincide. Interesting that some pros thorax (chest ) are rotating faster than the lead upper arm just before impact. Look at Corey Pavin, Ricky Fowler, Rory Mcllroy, Jim Furyk.
-
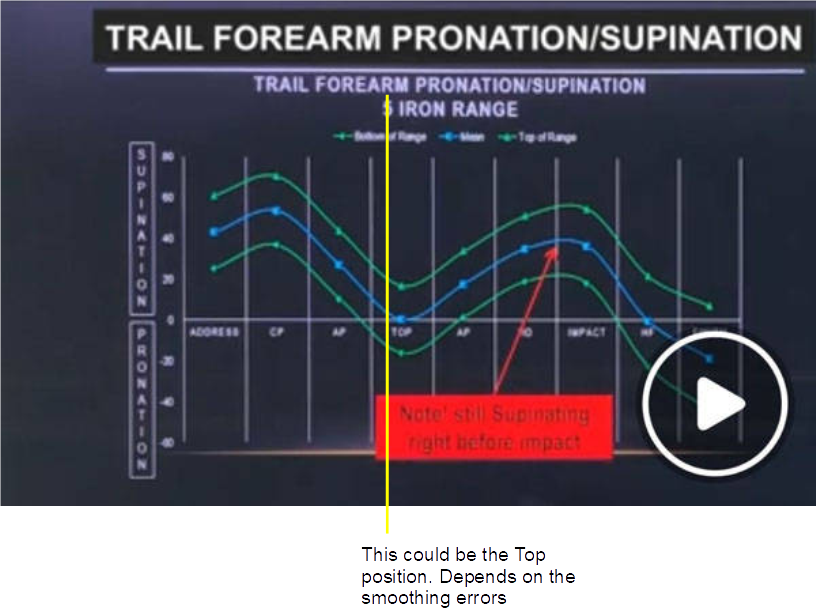
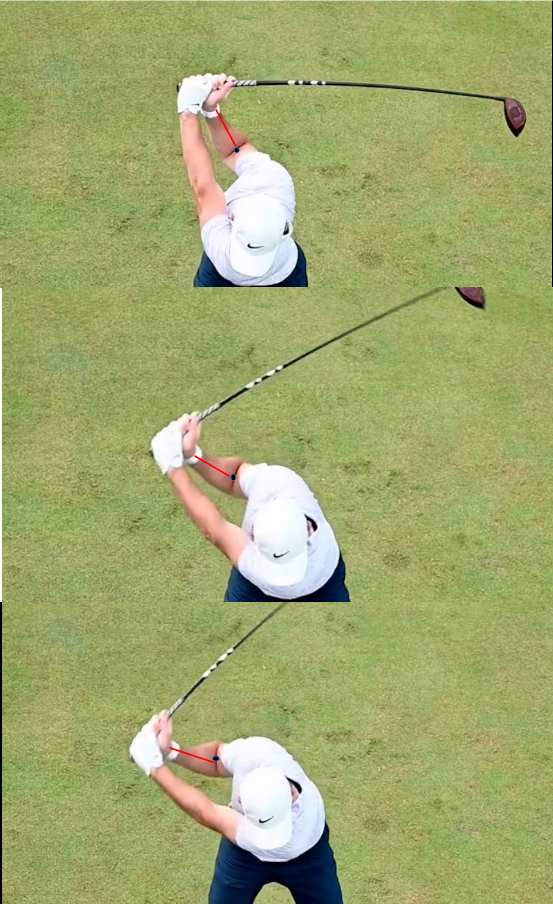
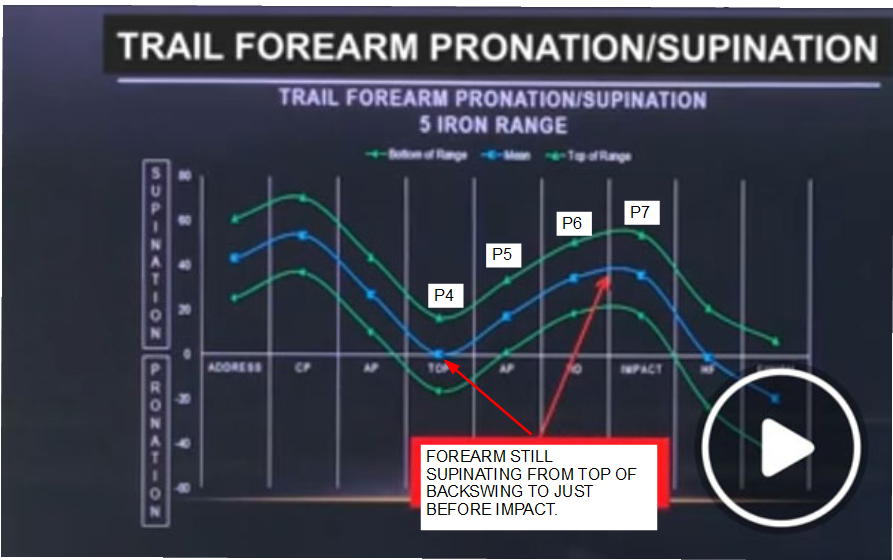
I have now found out that the Jon Sinclair graphs are so smoothed out that one cannot use the graph trending around specific positions . For example , the TOP position would have a horizontal error bar , and therefore could possibly shift to the left . This would therefore show the pro golfers trail forearm pronating in the early downswing before supinating later. Jon Sinclair has actually said that it is normal for pros to pronate their trail forearm in the early downswing. With regards the Pro graph , I have a few questions: 1.LUArmSP - I am guessing it means Lead Upper arm supination/pronation 2.TUArmSP - I am guessing it means Trail Upper arm supination/pronation 3.My other question is why does the scaling of the time axis vary?For example 0.3 -0.5 , then 0.5 - 0.8 , then 0.8 -1.0 , and so on..... The scale seems to change from 0.2 secs , then 0.3 sec, back to 0.2 secs , etc. Also how can the trail upper arm pronate while the forearm supinates? See graph again below where I have drawn some black arrows to identify the phase this happens. Doesn't make any sense to me from an anatomical perspective. Let's look at a top view of Rory's swing and although this is not 3d measurements , I've tried to guess how his trail radial bone, (ie. the part near his wrist joint) has rotated compared to its other end near the antecubital fossa. In the early downswing it does look like the trail forearm has pronated.

-
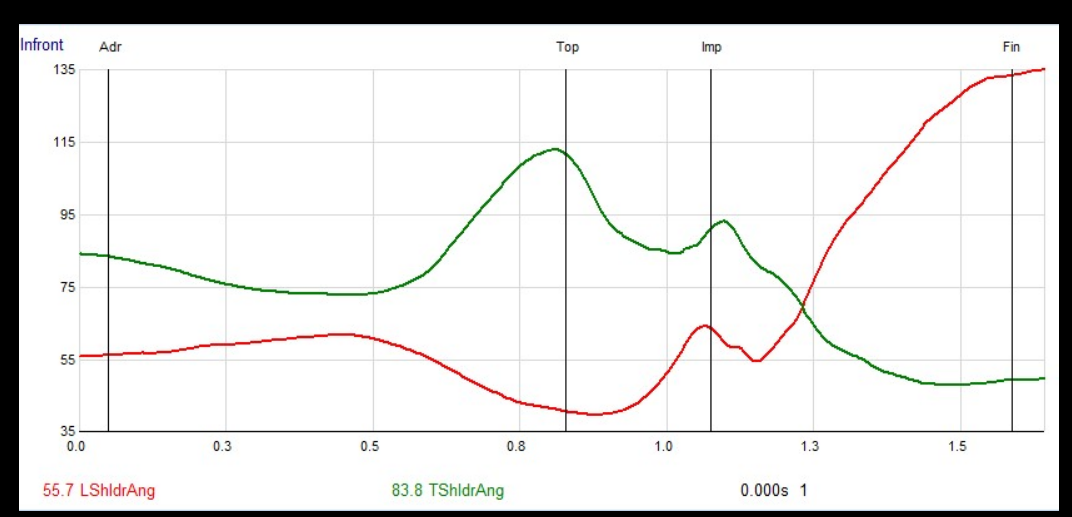
Some more interesting graphs of Pros where the elbow separation decreases during the downswing . It seems to tally with trail arm adduction like the images further below showing Tony Finau and Brooks Kepka. I've also shown a youtube image showing a pupil doing an exaggerated drill. External rotation of the upper arm is not a cause for the decrease in elbow separation. Here is a green lined graph of Pro1 trail arm angle (ie. see image further below which shows 'Lead' arm angle measurement relative to thorax). So imagine the same angle being measure but using the trail arm. The angle being measured will be a projected 3d angle onto the 'Transverse/Horizontal' plane . One can see that the 'Trail Arm Angle' graph (ie. green line) which is really a measure of horizontal adduction of the trail upper arm with the thorax (ie. chest) has virtually the same shape as the elbow separation graph . Therefore , it seems that there is a correlation although I cannot be 100% sure. Here is another graph (blue line) for one of the pros in the 1st 4 graphs whose trail forearm actually pronates in the early downswing before supinating (then loses a bit of supination just before impact). This graph seems to contradict the mean graphs that Jon Sinclair created for 65+ best pro golfers (see graph further below) that show the trail forearm supinating immediately in the downswing. I have now found out that the graph above should have horizontal error bars , therefore the positions (such as TOP) may not reflect the reality of the actual TOP of the backswing . In fact , I have found out that there is a slight degree of pronation by the trail forearm for most pro-golfers in the early downswing, maybe between P4 and P5. So the TOP position might actually be slightly further to the left on that graph. But there is a definite trend of supination for the rest of the downswing until the late downswing from P5- P6.5/6.7, then a little pronation to P7 (while still the trail forearm is still frankly supinated).


-
Golf Science - Wet Golf Ball
Wildthing replied to ryanedwardcook's topic in Lessons, Drills, Mental Game, and Fitness Tips
Here's a link that may help you. https://www.tutelman.com/golf/design/swing2.php If less friction between clubface and ball, the ball will slide up the face instead of rolling (ie. spin). So less spin and also the launch angle will be higher. When there is more friction between clubface and ball (ie. drier conditions) , some of that upward slide is lost due to the friction causing the ball to roll instead. The ball therefore doesn't slide up as much , the ball then ends up squashed enough against the clubface so that it doesn't slide any more (ie. friction is too large) , leaving the clubface at a lower launch angle. -
I now have a copy of Dr Kwon's research article titled "Assessment of planarity of the golf swing based on the functional swing plane of the clubhead and motion planes of the body points". For 14 skilled golfers , it basically shows body point movement planes (MP) during the golf swing relative to FSP (functional swing plane) but here are some of the findings/opinions that Dr Kwon stated : "It was concluded that skilled golfers exhibited well-defined and consistent FSP and MPs, and the shoulder/arm points moved on vastly different MPs and exhibited large deviations from the FSP. Skilled golfers in general exhibited semi-planar downswings with two distinct phases: a transition phase and a planar execution phase" "The trunk rotation and linear shoulder motion during the downswing/follow-through, therefore, tend to promote an off-plane motion of the clubhead (and a spiral swing) by pulling it down past the FSP. The relative orientations of the shoulder MP and trunk plane to the FSP and the curvature of the clubhead trajectory with respect to the FSP (in the semi-planar swing in particular) suggest that trunk rotation is not what drives the downswing and the arms move somewhat independently of the trunk in a fashion to secure a clean planar motion of the clubhead during the execution phase. Therefore, it is an unlikely scenario that a forceful trunk rotation directly generates a high impact velocity. The hand and clubhead motions during a downswing are produced by the combined efforts of the arms (shoulder and elbow joint motions), shoulder girdles (elevation/depression and winging), and trunk (rotation and lateral flexion). The position of the shoulder line with respect to the pelvis line at TB (X-factor) can affect the subsequent motions of the arms, shoulder girdles, and trunk (i.e. the motion paths of the hands and clubhead) and ultimately the FSP. Therefore, the difference in the X-factor/X-factor stretch among different skill groups may mean some fundamental differences in the swing technique (FSP, MPs, etc.), Functional swing plane and motion planes in golf which can then affect the clubhead velocity. Further investigations on biomechanically correct meanings of the X-factor/X-factor stretch are warranted to better explain the causal relationship between the X-factor and impact velocity/shot distance, if any." Isn't Dr Kwon suggesting that the rotation aspect the upper body pivot , is not a major contributor to clubhead speed? But when I look at his graphs below, there is some overlap of the instantaneous lead shoulder movement plane with the clubhead plane from TB (top of backswing P4) to ED (early downswing- shaft vertical P5.3). Look at the error deviations (vertical band of vertical lines traversing the graph lines) where I've drawn yellow arrows. In my opinion there could be some shoulder rotation contribution to clubhead speed in the early downswing. Maybe not in the FSP plane during the early downswing but it can be diverted back on the FSP by P6 (mid-downswing) without loss of clubhead speed,

-
Just wondering if the concept of identifying and categorising swing planes looking at a 'Down the Line' view in 2D is flawed? Many golf instructors /theorists use the below to try and identify how the swing plane changes during the downswing. When they describe the instantaneous plane the club shaft is moving within , they look at the above images and use the angle of inclination of the planes relative to the horizontal surface of the ground. But they are ignoring the fact that the 'instantaneous swing plane' is also rotating during the downswing as per the images below. These images below show the lead arm plane, but similarly it could also apply to the shaft swing plane too in 3D. For example, say the club shaft was swinging within the swing plane as shown below from P5.5 , one would look at the above image from a 2D DTL (Down The Line) view and deduce that it was approximately just below the 'right shoulder plane' . Then imagine that the club shaft swung into the impact P7 position as per far right image above . One would then deduce that the shaft had shifted to the elbow plane. But that might be incorrect because the golfer could have just lowered his arms while the club shaft was still swinging in that same instantaneous rotating swing plane at P5.5 to P7. Look at image 'b' below where I've drawn another instantaneous plane at impact P7 (ie. red dashed lines) where its base is pointing parallel to the ball-target line. The inclination angle of this 'rotating' club shaft swing plane with the horizontal z axis line is 'α' at P5.5 (image 'a') and could theoretically remained at constant 'α' angle at impact P7. In 2D one would have said the shaft had shifted planes during the downswing from 'right shoulder plane' to elbow plane. But in 3D , the shaft could have swung on a single rotating plane whose inclination angle with the surface of the ground was constant. Even measuring the angle 'α' relative to the Z axis seems incorrect (look at image below) although I could be mistaken. Shouldn't we be measuring angle 'θ' not angle 'α' ? That might be quite complicated to do but at least it would reflect the 3D reality of swinging in instantaneous rotating planes relative to the horizontal surface of the ground. Here are the 'α' and 'β' graphs of several golfers with different handicaps .


-
A research article titled claiming positive wrist torque can increase clubhead speed by 9% (ie. over and above the clubhead speed if no active wrist torque used). An Insight Into the Importance of Wrist Torque in Driving the Golfball (by Eric J Sprigings and Robert J Neal) http://people.stfx.ca/smackenz/courses/DirectedStudy/Articles/Sprigings 2000 Insight into the important of wrist torque.pdf They used a forward dynamics model swing and found a timed muscular wrist uncocking (radial-ulnar deviation) added after MOF release, can increase clubhead speed by 9%. In the model, the active wrist uncocking occurred when its arm segment was 30 degrees below a horizontal line drawn though the shoulder joint. If you time it too early or late it can lessen your clubhead speed (ie. less than the clubhead speed if no active wrist torque applied). If you look at the model , there is no forearm rotation and the swing is planar with the wrist joint only capable of radial/ulnar deviation. The swing with the wrist torque generator activated showed an increase in clubhead speed of 8 mph vs swing that just used MOF release (without any added active wrist torque). Further, the model was validated against 2D images of Nick Faldo's swing. Now the confusing aspect for me is that the graph shows positive wrist torque at impact which seems to contradict what Dave Tutelman said about the wrists not being able to keep up with the angular velocity of the club, which therefore applies a negative torque. There is no mention in the article whether the shaft was in forward or backward bend approaching impact. Considering the model is incapable of using forearm rotation , the only golfers that I thought could mimic this type of model swing would be golfers with very strong grips (like those used by Brendan Steele or David Duval) but does this mean positive wrist torque at impact is a possibility in a full driver swing? After reading the research article again , I noticed they set the wrist torque to over an above the average human male capability which seems max out less than 8 Nm . Why did they allow the wrist torque to maximise at 60 Nm? It makes no sense to create a forward dynamics model that can perform golf swings using torques outside human capability. Here are some diagrams from the article: The Model Clubhead speed graphs with and without musculature wrist torque , that needs to be impeccably timed just after MOF release. Plus a graph showing the torques applied to each of the model's joints. Here is the article that tested wrist strength for various scenarios. Wrist rotations about one or two axes affect maximum wrist strength https://www.sciencedirect.com/science/article/abs/pii/S0003687015300776 Here are some graphs for the relatively small sample of males/females used in the research. So we have less than 8Nm wrist torque in human males but the graph shows the model applying around 19-20 Nm. I can only assume that they have increased the max torque to 60 Nm to cater for any torque created by a real golfers trail arm (which the model doesn't have). The only way they can create the same 'effect' was to use the torque at the wrist joint , even though it is above a human's capability. Even so, it does not seem likely that a pro-golfer is going to risk using active positive wrist torque if it needs to be impeccably timed during the downswing. If they don't apply just the right amount of torque at the exact time , it will decrease their clubhead speed and create a non-optimal clubface/ball impact condition. Dave Tutelman did his own experiments trying to apply a positive torque and found it unlikely (see article link below on his excellent website). https://www.tutelman.com/golf/swing/handhit.php His conclusion was: "The clubhead is pulling the hands around as fast or faster than the hands can move under their own muscle power. So the hands just can't keep up well enough to apply a hit that could increase clubhead speed." Note : A 'HIT' means active wrist torque.


-
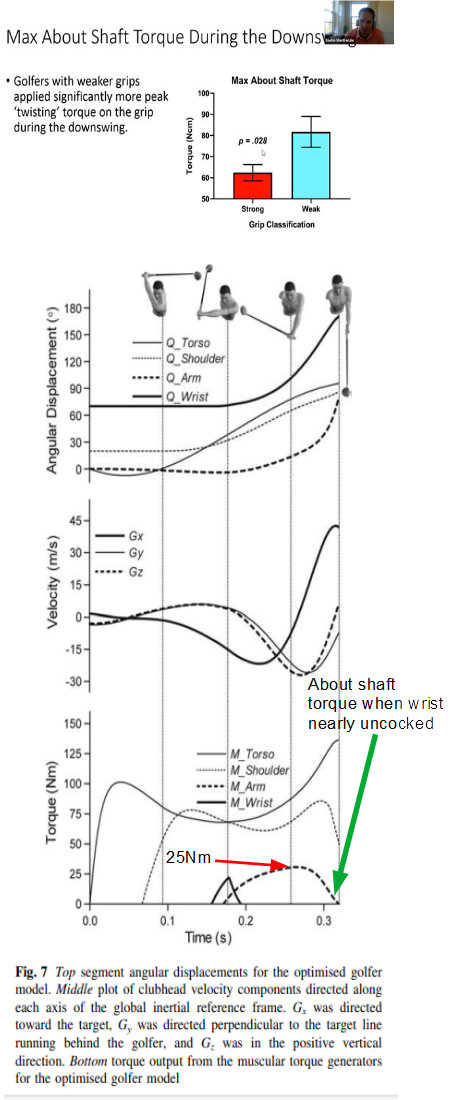
I was wondering whether PA#3 accumulator concept in TGM is a realistic way to increase clubhead speed using rotation of the lead arm/forearm . Some theorists like Dr Jeff Mann regard it as being used for club squaring rather than increasing clubhead speed . I therefore looked at Dr Sasho MacKenzie's research articles and found something that seems to suggest that active musculature supination of the lead forearm does increase clubhead speed. Within his research article "Club position relative to the golfer’s swing plane meaningfully affects swing dynamics" he uses a 'forward dynamics' model to simulate a golf swing and verifies it's integrity by comparing its movements with that of an expert professional golfer. The 2 simulated swings that was brought to my attention were as follows: SIM1 - A simulated golf swing that didn't use any forearm supination torque but where the club was squared at impact by passive torques - clubhead speed 36.2 m/s = 81 mph SIM3 - A simulated golf swing that did use active forearm supination torque to square the club at impact - clubhead speed 44.1 m/s = 99 mph SIM1 downswing started with the clubs COM positioned 7.3 cms below the lead arm swing plane. The torso/shoulder/wrist torque generators were switched on , while the whole arm torque generator for rotation about its longitudinal axis was switched off .The model was able to create a swing where the clubface was square at impact with clubhead velocity components in the x,y,z axis as shown further below. I think the ball trajectory would have been a fade looking at the table below . SIM3 downswing was initiated with the shaft perfectly within the golfer’s swing plane (ie. COM positioned 1.4 cm below lead arm swing plane) and the optimization was conducted with all the torque generators available to supply energy to the system (ie. including the arm rotation torque generator). Again, the model was able to create a swing where the clubface was square at impact with clubhead velocity components in the x,y,z axis as shown below. I think the ball trajectory would have been a draw looking at the table below. The results for SIM3 was the same for SIM5 (which was setup with 10 degree steeper lead arm swing plane) and the graphs showing the torques are below Fig 6. The graphs look very similar to another optimised swing by Dr Mackenzie in a different research article ,where he first introduced his forward dynamics model (see Fig 7), which generated a clubhead speed of 94.3 mph at impact. SMK said "the clubhead path employed an inside-to-outside clubhead path, which is characteristic of expert golfers". The interesting point is that the forearm/arm torque generator in 'SIM3 & SIM5' was switched on at about P5 and ramped up to a maximum torque of about 25 Nm at about P5.7 . This torque was applied to the whole mass of the 'arm/hand/club unit' but did not tumble the club over in any OTT fashion. The club path at impact still mirrored that of an expert golfer. The models torque capacity for rotation of the lead arm was increased over and above the capability of human muscles associated in the shoulder area. This was to cater for a missing trail arm capability. The important point to note was that active supination torque in SIM3/SIM5 seemed to be responsible for the increase in clubhead speed of 18 mph compared to SIM1 (ie. no supination torque). Doesn't this imply that PA#3 is not just a club squaring mechanism but can create a significant increase in clubhead speed if timed properly with all the other kinematic movements during the downswing? To answer the above question, we would need to know how much contribution to clubhead speed was due to the other torques too (ie. torso, shoulder, wrist ) for SIM1 and SIM3. If the torso /shoulder/wrist torques were the same (magnitude and timing) for SIM1 and SIM3 , then maybe we could consider active forearm/arm supination as the cause for the increase in clubhead speed . Therefore , we cannot categorically confirm that PA#3 is a clubhead speed producer. One interesting point I didn't notice before is that positive wrist torque happening at the same point as active supination torque starting from zero at P5.


-
A quick pictorial explanation why a smaller angle between the shaft and lead arm approaching impact will decrease rate of closure of clubface. I have just theorised that I could rotate my forearm/arm by 180 degrees while holding the club in radial deviation (ie. 90 degrees angle between shaft and lead arm) . The white dot on the club has not rotated , therefore hand twists velocity = zero and could reduce ROC (there are other variables that can affect ROC). Therefore, golfers like Henrik Stenson will have a lower HTV than Phil Mickelson (ie. PM has a very large angle between his lead arm and shaft approaching impact). Some other ways to torque the shaft (ie . twist the club) in space while the wrist is in radial deviation. Top image is just making your lead arm more vertical and the other is flexing the wrist. Another way to close the clubface from say P5.5 - P6 is to just allow your forearm to rotate at the elbow from horizontal to more vertical as per below (while the forearm is supinated) Look at the Sergio again where his right elbow is very close to the right side of his lower torso just above his trail hip (almost like a pivot point). He extends his elbow as per image above while his forearm is in supination and that closes the clubface relative to club path.


-
I have a possible theory how JS might be able to create those forces in the grip and I think it might be the protraction of his right scapula. Both his hands are involved in creating a positive torque on the grip that would tend to cause of rotation of the club anti-clockwise about the mid-hand-point on the club's grip. I know this is happening because the club is in backward bend and also rotating anti-clockwise (from a front view as per images below). A positive torque would cause an early release and an increase in the angle between the club shaft and lead arm. So why isn't that happening? The right scapula could be independently protracting (see image further below) and transmitting a force via the bent right 'arm/wrist/hand' across the club's grip. I have drawn some yellow arrows to show the force direction produced by the right scapula during the downswing . Similarly , this force would produce an identical red arrow force across the grip. That force across the grip produces a negative torque about the COM (centre of mass) of the club which would tend to cause the club to rotate clockwise (from the front view) and decrease the angle between the club shaft and lead arm (ie. increase lag- see image directly below). This is all guesswork and we won't know what forces/torques are being applied to the grip during the golf swing until more research is done. Addendum: On reflection , I think that Jamie is simply holding the lag angle using his wrists and not using the method above . Inverse dynamics basically isolates the club on a computer screen, takes high frequency snapshots of its movement in space and then works out what forces and couples are being applied to the club's mid-hand-point on the grip to create that movement. What if the club and arm(s) are being swung together as a 'rigid unit' by the body pivot? If Jamie was holding the lag angle , then inverse dynamics may be giving a false impression of what the golfer is anatomically doing in his real swing because its only looking at the club in isolation when it should be analysing the 'rigid unit'.

-
Another puzzle that I've never been able to understand : Here is Jamie Sadlowski https://www.youtube.com/watch?v=5gekd_JMFT4 Here are some screen frames where I've drawn red arrow forces in a general direction (ie. to represent some 'net force' applied to the grip of the club via his hands). This is only general guesswork because it will dictate approximately how the COM of the club (ie. the red dot) will move. The puzzling thing is how on earth can Jamie anatomically create a force in the directions seen in images 1-5 (while his hands are going down and outwards away from target) and not release the club early? One thing I have found out is that he is a 'reverse foot' golfer which means his COP moves to his rear foot from P6-P7 .

-
Great video on using ground forces
Wildthing replied to Hook DeLoft's topic in Lessons, Drills, Mental Game, and Fitness Tips
I've seen and heard Marcus Bell before , and being from a physics background (he uses various physics terms), I haven't a clue what he's talking about most of the time. Your better off checking out Dr Kwon and Dr Scott Lynn who are the experts in GRF patterns. For example , check out 35:18 of this video below and look at the graphs for Gary Woodland , who hits the ball a mile but whose vertical ground reaction forces are quite small. He uses 'Torque' as his major power source in the swing , so would changing him to use larger 'Vertical GRF's ' improve his swing ? Apparently , golfers are 'messy' and can create different grf patterns . Remember that GRF's are what they mean ' Ground Reaction Forces' . You are contracting your various muscles to swing a golf club in a manner you perceive is correct (whether right or wrong) . To help facilitate the movements you are planning to perform when you contract your muscles , you might need to brace/push against the ground. https://www.youtube.com/watch?v=-12QXRPgrzs -
I have found a puzzling issue: Dr Sasho Mackenzie designed a computer model of a golfer (no legs - see diagrams at the end of my post). I won't go into too much detail but the model matched almost perfectly the kinematics of a live golfer's swing as shown in the graphs Fig 6 (if you can make it out, as the copy and paste is very blurry for some reason). Clubhead speed was also very close with a root mean square error of 1.32m/s. They used a high speed camera to take 2D images of the golfer and compared it to the model to see if it matched. The torque generators that drove the models body parts was then optimised for clubhead speed while ensuring that the clubface was square at impact (the club path was in-out just like many PGA pros). Although the clubhead speed was 7 m/s slower than PGA players , the optimised graph (Fig7) showed that the model had to apply a torque of 25 Nm during the downswing. This torque would be modelling the internal/external rotation of the lead upper arm and supination/pronation of the lead forearm. The model torque generators were designed such that they replicated human muscle as close as possible (see quote from research article below). "Four torque generators, which adhered to the activation rates and force–velocity properties of human muscle, were incorporated to provide the model with the capability of controlling energy to the system. The force–length property of muscle was not incorporated into the torque generators as it was expected to play a second order role". The M_Shoulder torque generator capability in the model was doubled to cater for a missing trail arm. My puzzle is quite obvious and is shown in Fig 7 and the 'Choi' graphs 'O' and 'S' bottom left. Those Choi graphs were created using a very expensive high-tech instrumented grip that was attached to the golf club. It actually measured the forces and torques being applied during the downswing for a small sample of golfers . Dave Tutelman did an analysis that seemed to show several issues in the method used and inconsistencies in Choi's graphs vs inverse dynamic graphs created by Dr Sasho MacKenzie, Dr Kwon and Dr Steven Nesbit (all well renowned biomechanic scientists). In the model , the 'arm' generator maxed out at 25 Nm torque that was basically used to square the clubface by impact (see Fig 7). But if you look at the Choi graphs , there is virtually zero torque being applied by either lead and trail hand to square the clubface. I've drawn red dotted lines where 25Nm would be approximately on the 'O' and 'S' graphs . I cannot imagine that the high-tech grip would show such a discrepancy with the model unless the Choi golfers were using different kinetics to square the clubface without any large musculature effort involved in rotating both trail and lead 'arms/forearms'. Got the above wrong I'm afraid . The forward dynamics model was applying torque about the axis of its longitudinal arm , while Choi's graphs was torque about the longitudinal axis of the shaft. Only when the wrist has uncocked and the longitudinal axis of the arm and shaft are virtually in alignment can the M_Arm graph be used to assess the torque being applied 'about the shaft' (see green arrow in image further below). I can only assume that maybe there is some truth in using Dr Mackenzie's passive clubface squaring torque method as depicted in this image below. This involved no muscular rotation of the arms/forearms but having a slightly steeper hand path plane compare to the club shaft plane by P5 (maybe even later) in the downswing. The physics to explain this affect is a bit complicated , especially if you don't have a physics/maths background but you can test it out yourself at the range using lead armed swings only. You'll probably figure it out intuitively and feel the clubface squaring without using significant musculature lead arm/forearm rotation. Dr Mackenzie tried to explain the above in a you-tube video with Chris Como (which I may have posted before). https://www.youtube.com/watch?v=37tFFPBvbpk I cannot be certain if the above is being used by many pro-tour golfers. Maybe things would become clearer if similar research to Choi was done in the future, but where improvements could be made as recommended by Dave Tutelman in the link below. https://www.tutelman.com/golf/swing/openloop.php


-
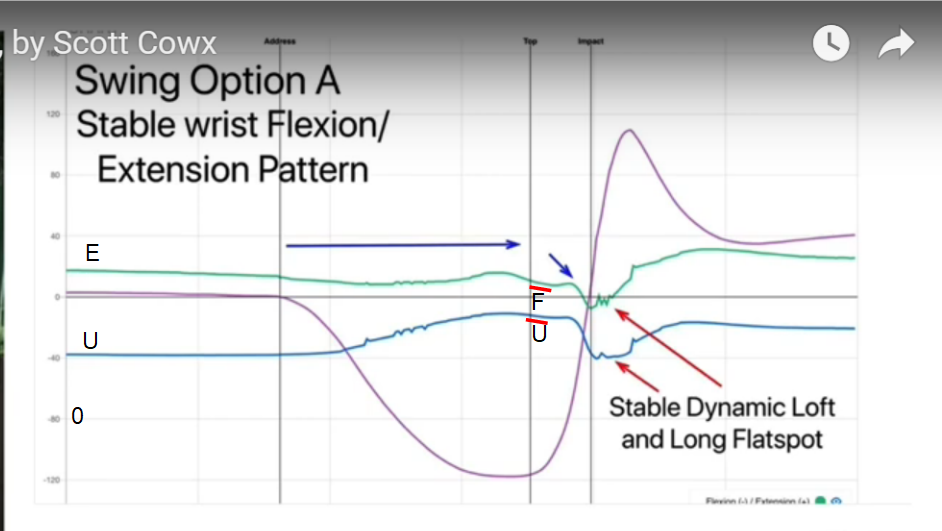
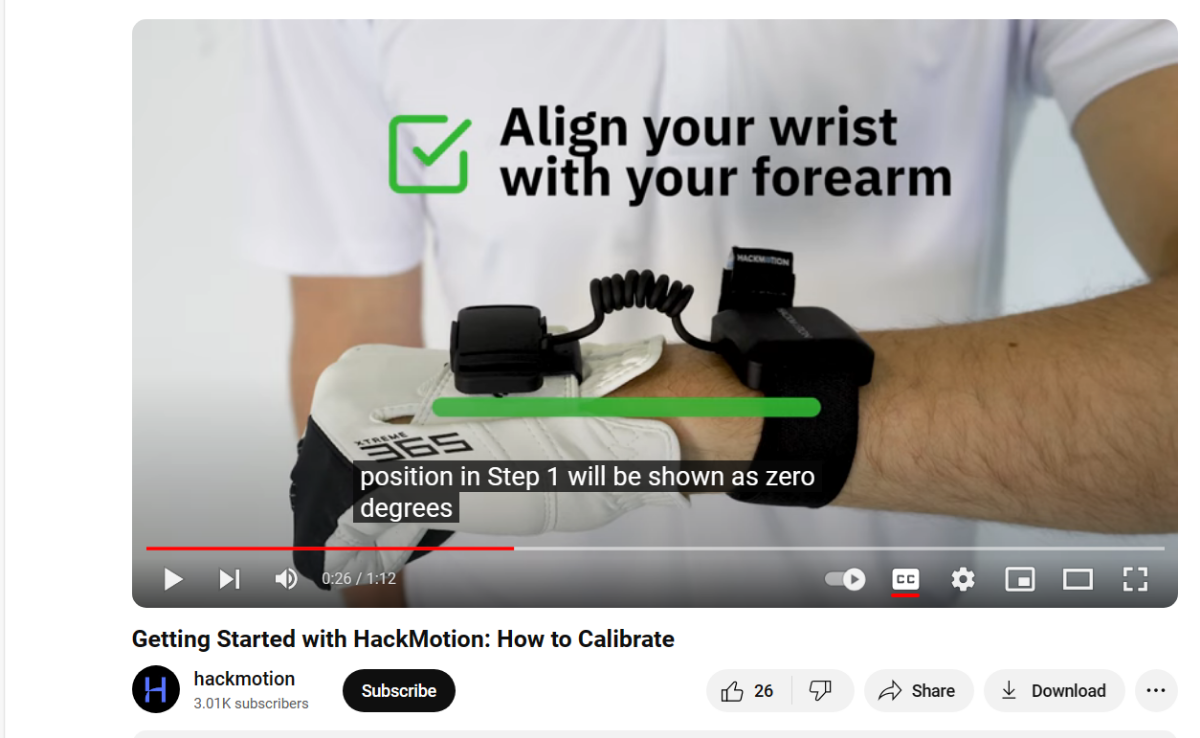
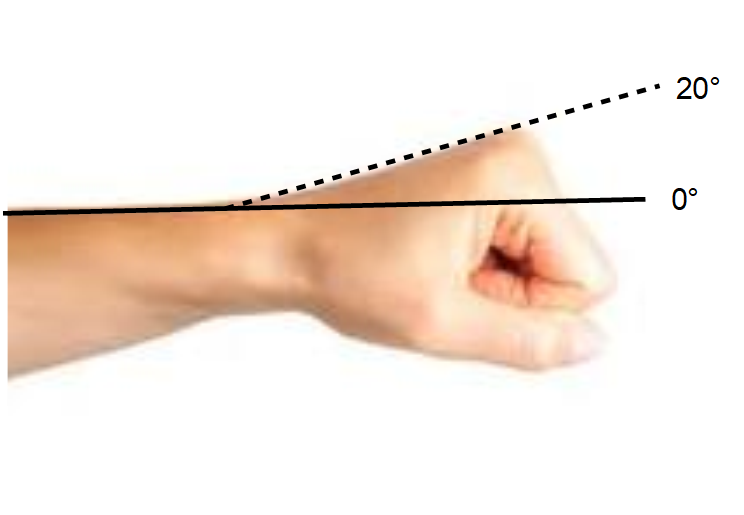
HackMotion data was used to identify the early cast so lets look at 3 different wrist patterns that Scott Cowx says he's identified being used by Pro golfers . The graphs can be explained as per below: The only category that has a bit of early cast including a very small amount of lead wrist ulnar deviation and flexion is type A . I have drawn little red lines to show F (Flexion or bowing of lead wrist) and U to represent ulnar deviation (uncocking of lead wrist). The problem with HackMotion and other superior 3D systems like AMM and GEARS is the way they calibrate wrist flexion and extension . The image below is how they calibrate for the zero measurement. You can see it's flawed because when you grip a club, without 'ANATOMICALLY' bowing or cupping your wrist, the shape of your hand looks like the image below. HackMotion , AMM and GEARS will register a measurement of 20 degrees cupped (ie. in extension) for the position above , therefore the graphs do NOT represent the 'ANATOMICAL' reality of your wrist positions in the golf swing. The slopes of the graphs are more important than the actual extension/flexion values and graph A does seem to show small values of cast/ulnar in the early downswing , but remember that there are always errors with devices that use sensors (especially noise and sensor movements). You will need to decide yourselves , whether the information shown in the HackMotion graphs are enough to convince you to ingrain an early cast action in your golf swing.


-
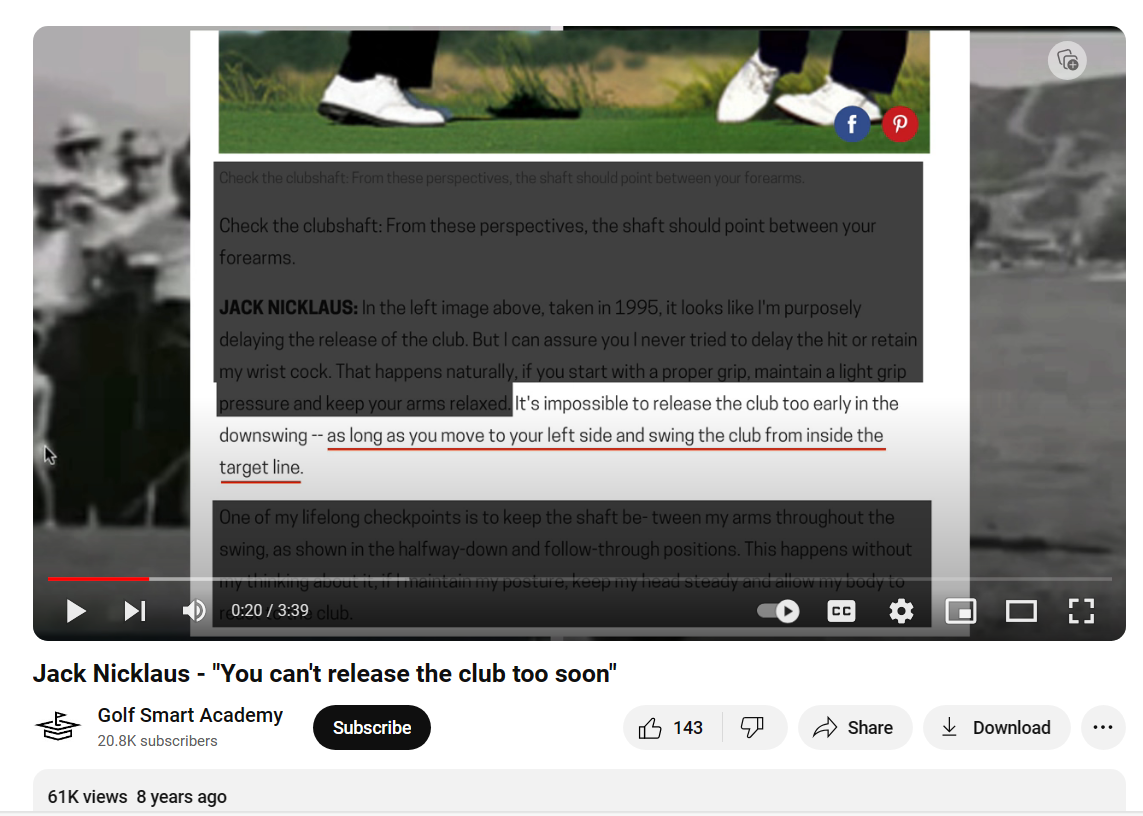
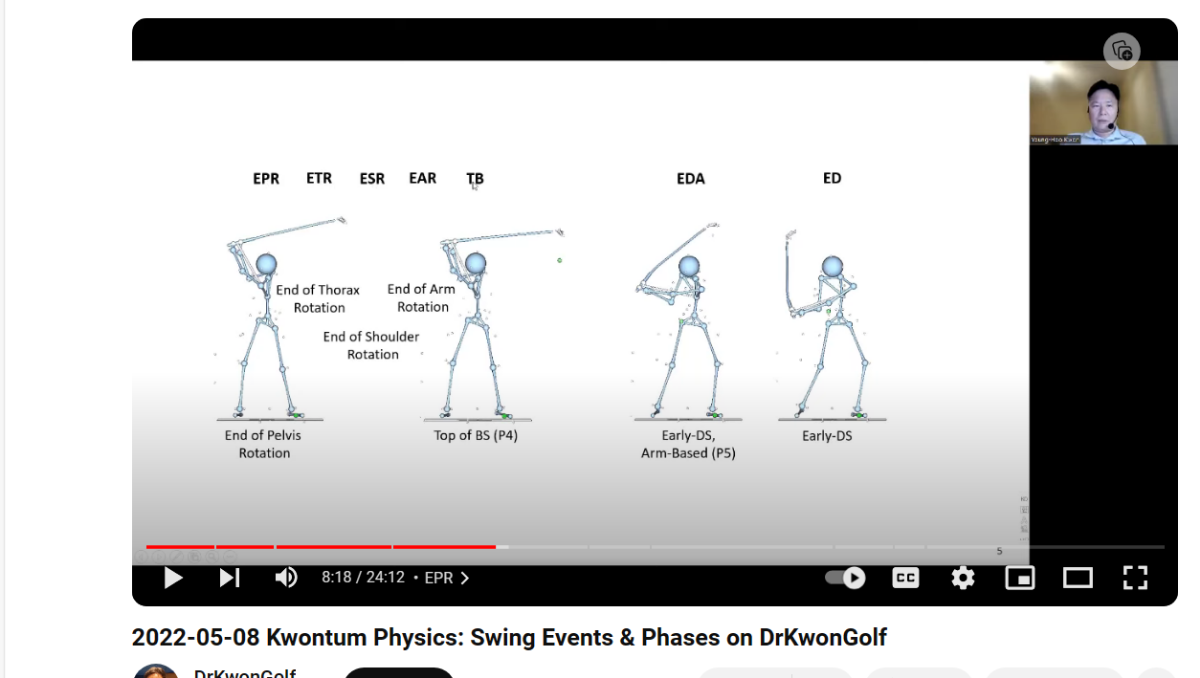
Jack Nicklaus said the following and notice the caveat. His video is here and he quotes something similar to the above although he omits the part "and swing the club from inside the target line" https://www.youtube.com/watch?v=WZV974MuA_k With regards the early cast opinions , that might be a 'feel' to prevent golfers from actively trying to hold the lag angle. If you don't 'actively hold' lag angles and you are applying the correct forces on the club to retain the lag angle (using the physics phenomenon of an eccentric force) , then you may not need to use an early cast action. With regards determining whether an early cast (ie. loss of lag angle between lead arm and club shaft) is happening, I have yet to see the evidence that shows 'all/most' tour pros are doing this move. Here are some more graphs: Dr Phil Cheetham : Look at the red graph from the 'Top' of the backswing and you will notice that the lead wrist angle is a plateau, no change in uncocking/ulnar deviation happening in the early downswing until the position shown on the avatar (ie. which corresponds to the vertical green line position on the graph). However , he does say other golfers (not all) , release it in 2 stages , slightly at first and then rapidly into impact. Dr Kwon The MC on the right graph is the point of 'Maximum Wrist Cock' and happens just before the EDA vertical line which corresponds to this position below (ie. just before lead arm horizontal). There is no early cast (uncocking) happening in these graphs. Further , one cannot trust the accuracy of 3D systems for subtle micro-moves being used for golf instruction purposes and that's because they are prone to several errors such as: 1. Flawed calibration of AMM and GEARS, especially when measuring wrist cupping and bowing (ie. extension and flexion). 2. Inertial and optical sensors move around on the body , especially near the wrists, where the skin, muscle and clothing tend to slip under the sensors. 3. Noise in the systems and even breaks in the signal between the transmitters /sensors/receptors. Addendum: Looking at that AMG video they are making statements at the top of the backswing of those 'Bowed /Flat/Neutral' lead wrist golfers that do not make any sense to me. The clubface is not open or closed to the club path but to the instantaneous 'Swing Plane'. I have mentioned several times in previous posts that a bowed lead wrist from P6-P7 will tend to cause forward shaft lean and open the clubface relative to the ball-target line.


-
On further investigation about the AMG video I posted regarded early extension , I have been contacted by a 3D expert in GEARS who advises that those measurements cannot be made in GEARS system. That the only way the AMG team could have produced those angle values were by using avatar images , putting dots on them and then measuring with a 2D tool. He also advises me that AMG have produced many good videos but also unbelievably poor ones too , sometimes for marketing purposes. I don't blame AMG for marketing their product but they must be very careful producing videos that may give golfers inaccurate data or false perceptions.
-
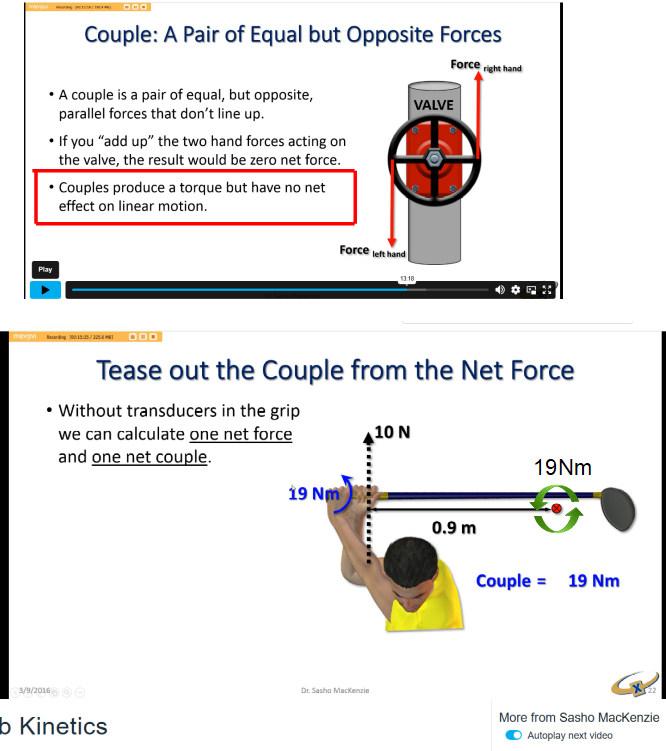
On another matter , I have been looking again at Dr Sasho Mackenzie's 'Intro To Kinetics' video . https://vimeo.com/158419250 I think the following 2 screen images might confuse people who don't really understand how a 'pure couple' (applied via the hands) moves the club. If you look at the 1st screen, I have highlighted a bullet point in a red box. Note what is says regarding a couple , that it has "no net effect on linear motion' . This means that a couple applied at the grip will not move the COM of the club in a linear direction (the COM cannot move in space). But if you look at the 2nd image , he has drawn (by mathematical convention) the couple 19 Nm about the mid-hand-point . A person seeing that image might assume that the club is being rotated about that mid-hand-point but that is incorrect . That couple would cause rotation of the club about the COM which I have added into the image (see green rotation arrows around the COM). I think one has got to be careful assuming how forces and couples might move the club when using inverse dynamics, because it could give a false 'feel' perspective.
-
Maybe , but no-one can 100% categorically know cause and effect in the golf swing, not even Monte Scheinblum. Golf instructors can try different fixes, and if it works , fine. The fact that one can measure/identify EE in a golf swing is a signpost that something may be going wrong. My point is pelvic thrust is not the only kinematic variable that should be used to identify EE.
-
Here is another issue about defining early extension. Look at the Sportsbox video with Dr Phil Cheetham from 20:20 , who seems to infer progressive pelvic thrust (ie. forward towards the ball-target line) in the downswing , or retention of any pelvic thrust in the downswing (done during the backswing) is a sign of an early extension fault. https://www.youtube.com/watch?v=2vlbCyjLzLU But I think its more complicated than the above to define an EE (early extension) fault, which is also defined by EA Tischler below: https://www.youtube.com/watch?v=fW9Xhim4uoY Further , Dr Jeff Mann has another opinion: "When I think of the swing fault of 'early extension', I think of the the pelvis going from a condition of anterior pelvic tilt to a condition of posterior pelvis tilt and it is a 'standing-up' phenomenon because if the pelvis moves towards posterior pelvic tilt then a line drawn perpendicular to the pelvic axis between the upper sacrum and the symphysis pubis becomes more vertical. That 'early extension change can occur with, or without, a pelvic thrust motion in the direction of the ball-target line. It is also possible for the center of the pelvis to move towards the ball-target line without any change in pelvic tilt angle - and that would not represent an 'early extension' swing fault. Phil Cheetham's graph is measuring pelvic thrust, and it is not measuring changes in the pelvic tilt angle." The above EE fault as explained by Dr Mann happens before P5 in the downswing. The description of anterior and posterior pelvic tilt is explained in this video by Dr Greg Rose: https://www.youtube.com/watch?v=SU-MQnnP4Ts Here are examples of 3 golfers pelvic tilt (red line) and pelvic thrust (green line) during their golf swing: My own translation of those graphs are as follows: 1st graph - it seems that the golfer has anterior pelvic tilt during the downswing , loses that slightly in the early downswing , then increases slightly again in the late downswing. So not much change from original address position which has 13 degrees anterior pelvic tilt. Yet he/she has also thrusted their pelvis towards ball-target line in the backswing and has generally retained that thrust value throughout the downswing. So in effect , that is a net forward thrust without any increase in posterior pelvic tilt . According to the definition in my opening post, that would not be deemed to be early extension. 2nd/3rd graphs - show no increases in posterior pelvic tilt in the early downswing (ie. before P5), and no significant pelvic forward thrust (ie. butt cheeks not moving towards ball-target line and kept against the 'wall/tush line'), therefore no early extension. So, according Dr Mann's definition (and probably EA Tischler) we might conclude that none of those graphs are showing 'EE' even though there is obvious pelvic thrust happening early in the backswing for 1st graph. Early extension needs to be clearly defined before being used as a swing fault explanation. PS. Here are some additional graphs showing typical pelvic tilt for typical PGA/LPGA players.


-
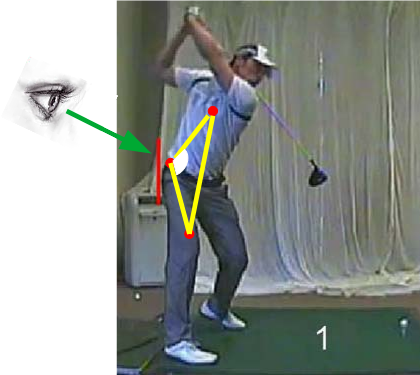
Checking out that AMG video again, now I think their measurements are flawed because their camera was only moving from a changing DTL view and not normal to that triangular plane (as per my eye drawing in previous post). Therefore, they will be measuring projected angles rather than the real 3D angles. So for example, in reality the lead side triangle might actually be increasing just before impact from the 'eye' view , but because that triangular plane being tilted away from the target, its projected angle might show a decrease due to parallax.
-
This new AMG video about early extension is interesting but I don't know if there is any scientific validation in the way they define it for the lead and trail side of a golfer. Early extension is usually defined as the centre of pelvis thrust towards the ball-target line , usually in the backswing and early downswing . AMG are using strange marker point placements in the centre of the chest , the hip and knee joints. https://youtu.be/yepkMQdy0Z4 The angle they are measuring is generally an obtuse angle of a triangular plane formed by those 3 marker points (see image below for the trail side triangle only but obviously there will be one on the lead side too). Anyhow , quite an interesting video.